What hides in plain sight
An evidence-led look at what concentration costs, and how to see it before it costs you.

The Story
In December 1989, a Japanese salaryman with thirty years until retirement was holding the obvious portfolio. Forty-five percent of the world's equity capital sat in Japan. Toyota, Sony, Mitsubishi, NTT, the companies that had won the eighties. The Nikkei was at 38,915. The reasonable thing to do was buy more Japan.
He retired in 2024.
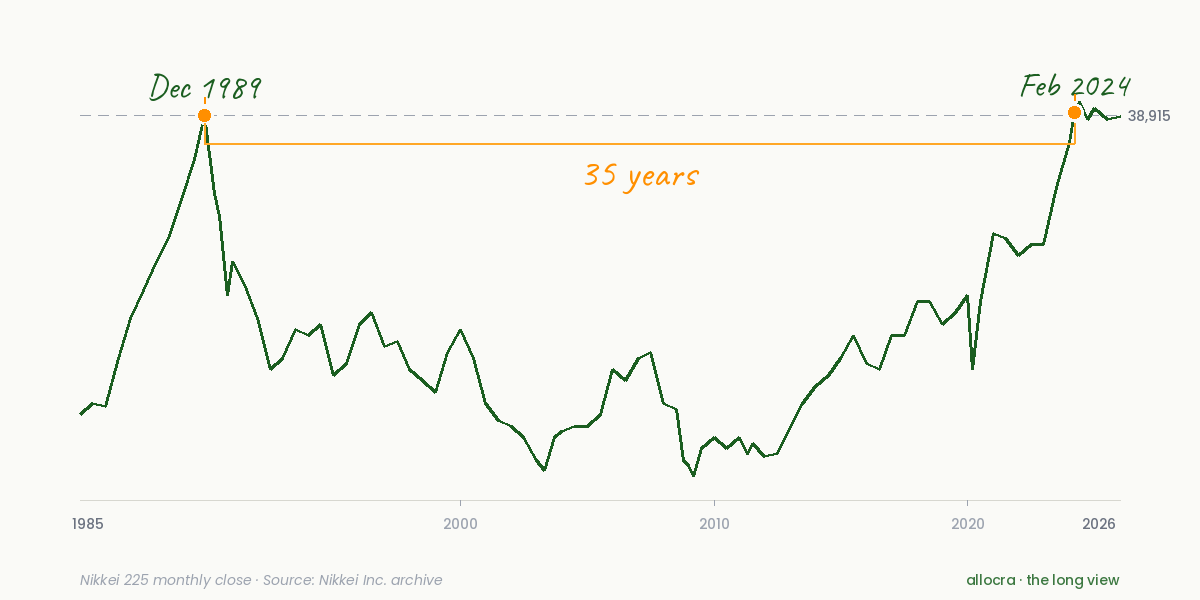
The Nikkei surpassed 38,915 again in February of that year. For thirty-five years between his most confident allocation decision and his actual retirement, the index sat below the price he paid. Not crashed. Just patient. Waiting for him to be wrong for longer than most careers last.
He didn't lose his money. He lost what it could have become. The same yen, spread across the developed world instead of concentrated in Japan, would have multiplied roughly tenfold over those thirty-five years. The story of concentration risk is rarely told as a crash. More often it is told as a number that did not move while everywhere else did.
That salaryman wasn't a fool. He was reasoning forward from fifteen years of evidence. Japan had compounded faster than the rest of the world from 1974 to 1989. The thing he couldn't see was that "the obvious place to be" and "the place that has just been the obvious place to be" are not the same place.
The obvious place to be and the place that has just been the obvious place to be are not the same place.
Today, the obvious place is the United States. Sixty-three percent of world equity capital. The seven largest US companies account for a third of the S&P 500's market value. The typical UK independent investor's portfolio held in three or four broad ETFs sits ninety-one percent in the US and forty-two percent in technology when you look inside it.
This isn't an accusation. The data doesn't say you are wrong. It says you are reasoning forward from fifteen years of evidence, the same way the salaryman did.
We can't know whether US tech in 2026 is like Japan in 1989, or whether it's different this time. What we can do is see what's in our portfolios with clear eyes, before deciding what to do about it.
Allocra shipped a tool on Wednesday that does exactly that. Paste your tickers and see what's inside. Not as advice. Just as data.

Hype Watch
A new category of thematic fund has multiplied this year: AI Memory ETFs. The pitch is the picks-and-shovels play on the AI data-centre build-out, own the firms that make the chips inside every accelerator. UK financial podcasts have framed these as "the rational way to own the AI boom."
Look inside three of the largest. The same five names appear in roughly the same weights: Micron, SK Hynix, Samsung, Western Digital, NAND Flash. Fee load averages 0.75 percent. The MSCI World, which already holds all five, charges 0.20 percent.
Two risks worth naming.
You may already own them. If your portfolio includes a broad world ETF or an S&P 500 tracker, the same five chip makers are already inside, weighted to their market cap. Paying 55 basis points a year to buy them a second time, more concentrated, is an expensive way to own what you already own.
Heavy trading hurts every holder. Each share of an ETF should be worth the value of the stocks inside it. When a fund goes viral, the share price drifts above that, and the gap between buy and sell prices widens at the same time. On £10,000 invested during a hype phase, those two costs typically add £100 to £150, paid to the traders working the noise, not to you. They appear every time you enter or exit during the hype, even if you only ever held patiently.

The Closer
The Long View is general educational content for UK and US independent investors. It is not investment, tax, financial, or any other form of regulated advice. Allocra Ltd is not authorised or regulated by the Financial Conduct Authority. Past performance is not a guide to future returns.
Issue 1 of The Long View. Published 19 June 2026. Forward this issue to one independent investor friend.
allocra
Cut the noise. Cut the fees.