Top of the Pops
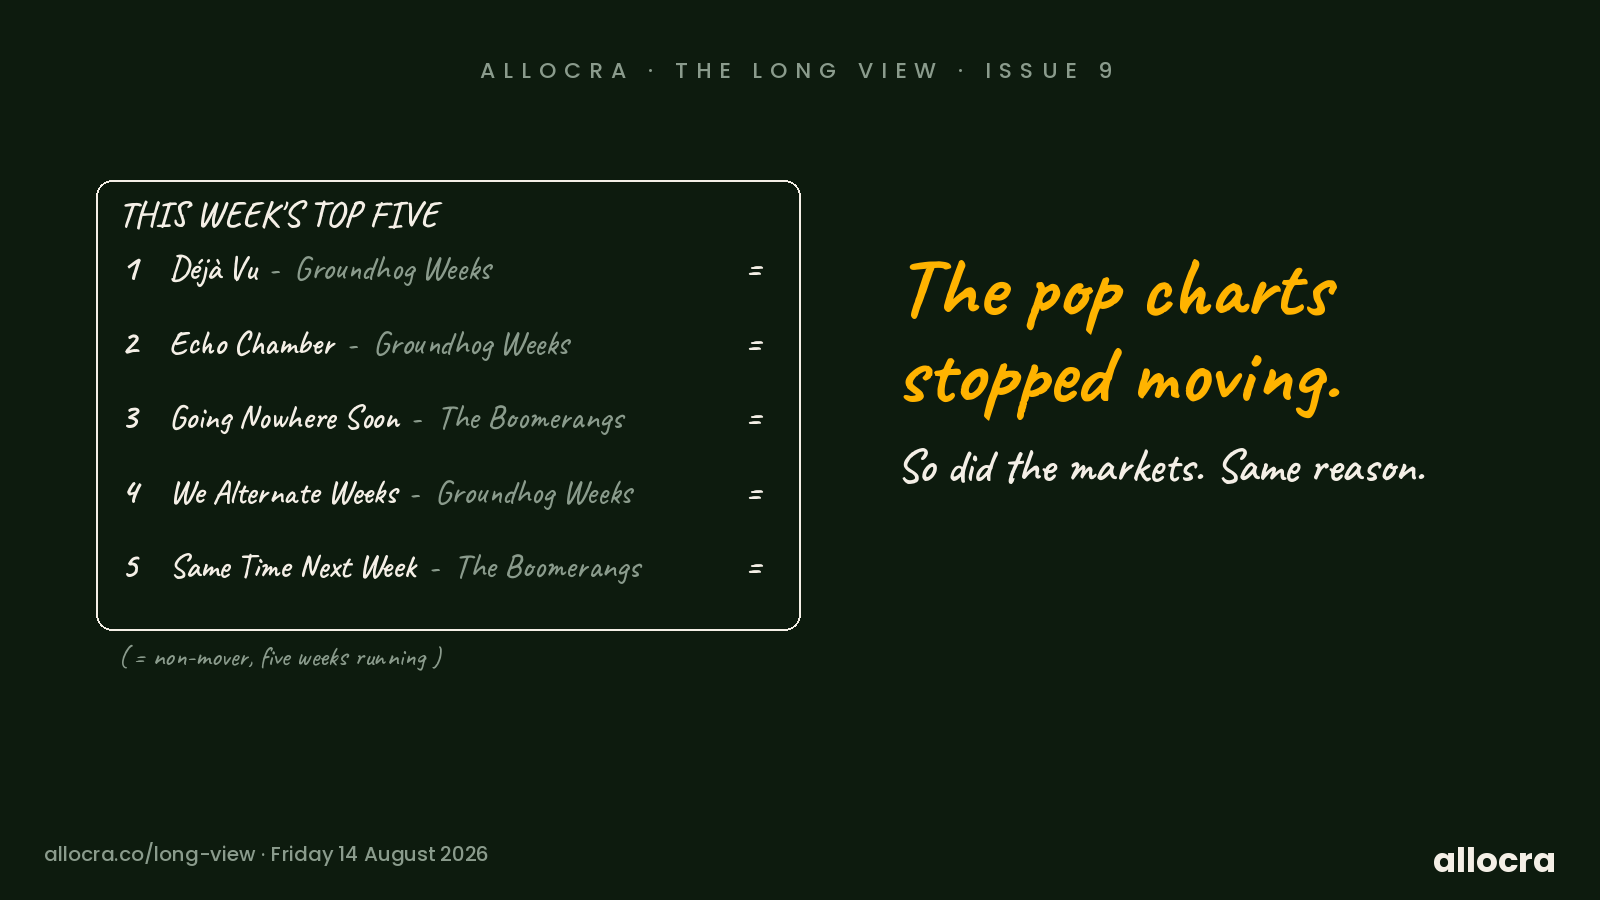
Every Thursday night for a generation, British households gathered round their televisions to find out the new number one. Everyone in the room, particularly the children, was excited by the top 10 countdown. Then the charts stopped moving. So, quietly, did the markets - and for the same reason.

The Story
Do you remember Top of the Pops? Every Thursday there was a different top ten, and anticipating the countdown was half the fun. The chart was gloriously unstable. One week punk, the next synth-pop, then a novelty record that nobody could admit to liking, but everyone could sing. The leaderboard shuffled constantly, and every Christmas brought a brand-new, unpredictable contender for the top spot.
Here is a question worth considering: why could Top of the Pops never exist in that format today?
Because the charts do not move anymore. The same two December songs climb back to the top of the chart every year, as reliably as the decorations. For the rest of the year, a handful of mega-artists sit in the top ten for months on end. A countdown show needs a chart that counts down to a surprise. There are no surprises left to count down to.
What happened to music is worth understanding, because the same thing happened to your index fund.
Streaming changed how popularity works. The algorithms reward what is already popular: the more plays an artist gets, the more playlists they lead, which drives more plays. Popularity became self-reinforcing. The chart stopped being a scoreboard and became a flywheel.
Now look at how an index fund works. Most track their market by weighting companies according to size - market capitalisation, in the jargon: the bigger the company, the bigger its slice of the fund. So, when you put money into a ‘broad market’ ETF, it is not spread evenly across hundreds of companies. The majority flows straight to the giants at the top, which supports their prices, which increases their weight, which directs the next pound the same way. The more owned a company is, the more owned it becomes.
Same machine. Different venue.
Which brings us to the uncomfortable part. You think you are buying diversity. You are, to a real extent, funding concentration.
A ‘Top 40 Hits’ album today gets you twenty songs by roughly two artists. And a ‘diversified’ S&P 500 tracker? The issuer’s own holdings file puts just under 38% of the fund in its ten largest names. Ten companies out of five hundred, carrying well over a third of your money. The top three alone carry a fifth. That is not a flaw in the fund; it is the fund doing exactly what it says, weighting by size in a market where size now feeds itself.
You are not spreading your risk across the whole economy. You are buying the same five streaming hits, played on loop.
Does this mean broad index investing is broken? Not necessarily. Holding the giants has generated incredible returns, and anyone who bet against them over the last decade paid heavily for the privilege. This is not a warning to sell anything, and the biggest names are big for reasons.
It is simply a request to know what you own. Next time you buy a ‘diversified’ index fund expecting a wide, varied buffet, remember what the chart has become: you are mostly buying tickets to the same mega-arena tour everyone else is already attending. Go, by all means. The show has been excellent. Just do not mistake the front five rows for the whole of music.
The workings: where the 38% comes from
Top-ten concentration: 37.97% of iShares Core S&P 500 (CSPX), BlackRock published holdings, as of 3 August 2026. Independent cross-check: 37.94% via the iShares S&P 500 (IUSA) file dated 4 August - two issuers, two files, agreeing to within three basis points. Top three (NVIDIA 7.7%, Apple 6.8%, Microsoft 5.5%) sum to 20.0%. These figures live in Allocra’s composition feed and refresh weekly. Every claim dated; where we cannot verify, we show a dash rather than a guess.

Hype Watch · The New Entries
While the top of the chart stands still, the industry keeps pressing new singles. This month brought a fresh entry: space-economy ETFs, launched amid excitement about the commercialisation of space and an initial public offering that everyone expects and nobody has seen. New entries exist because novelty is what a static chart has left to sell - the record marked ‘new at forty, with a bullet’. Some new entries become catalogue. Most become the box of singles at the car boot sale. The chart will not tell you which is which; only time and the holdings will.

The Closer
The charts will have the same number one next week. That is rather the point. Your job is not to guess the chart; it is to know how much of your money is standing in the front five rows - and to decide, on purpose, whether that is where you want it. Our ETF X-Ray reads a fund’s own published holdings and shows you exactly that, workings included.
The pop charts stopped moving. So did the markets. Same reason.
Got a Hype Watch suggestion? Send it to hype@allocra.co